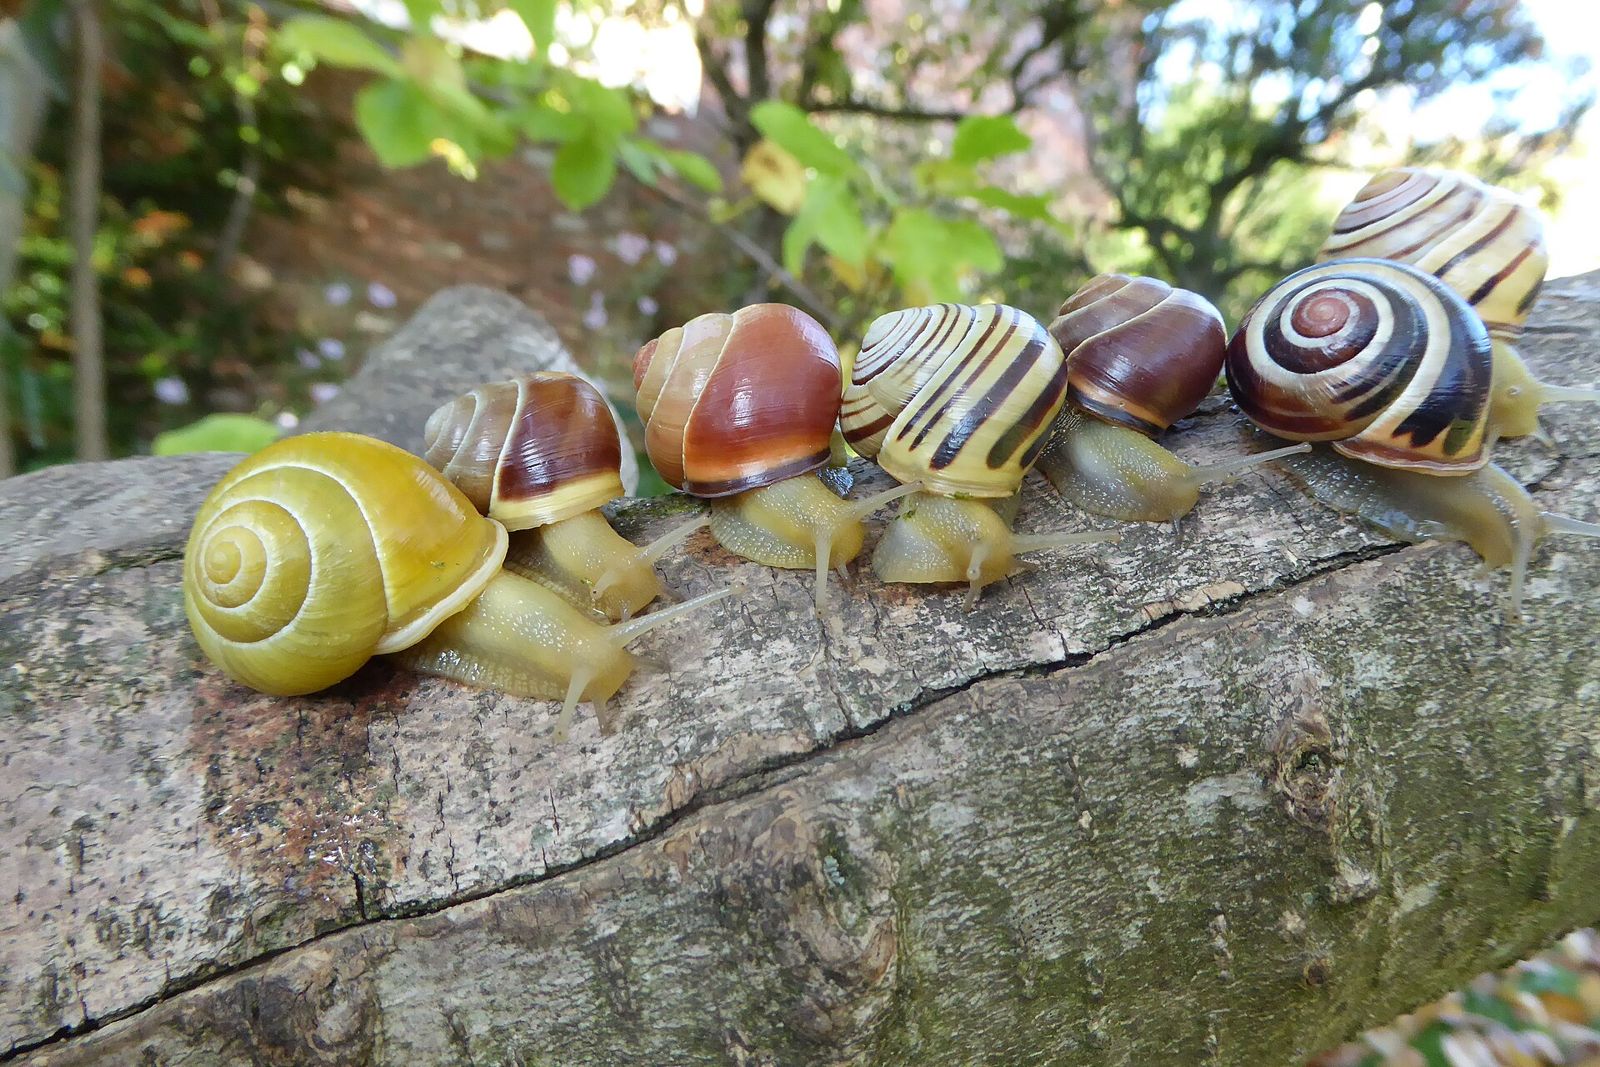
A row of grove snails on a log, each with a different shell colour and banding pattern

Year 9 Science · Lesson 7

Variation

Same species, all different

Grove snails, one species. Angus Davison. CC BY-SA 4.0

Starter

Everyone in this room is Homo sapiens

So why does nobody look the same? List five ways people in this class differ.

Which of your differences could you measure with a number? Which fall into groups?

Key word · Lab manual p12

Variation

Variation is the differences between individuals of the same species.

The snails on the title slide are all one species, Cepaea nemoralis. Shell colour and banding vary from snail to snail.

Much of this variation comes from differences in genes, passed down from parents. That's why variation matters so much for natural selection next lesson.

Two kinds

Groups or a smooth range?

Falls into clear groups
Eye colour, blood group, whether you can roll your tongue.

Controlled by just a few genes. Draw a bar graph.

Any value in a range
Height, hand length, mass.

Controlled by many genes, plus your environment: food, sleep, health. Draw a histogram.

Lab manual p12

Collect the class data

  1. Measure your height in cm. Shoes off, back against the wall.
  2. Measure your hand length in cm: tip of the middle finger to the crease of the wrist.
  3. Note your eye colour.
  4. Add your results to the class data, then complete both tally tables.

Measure twice. If the two readings differ, measure a third time.

Groups → bar graph

Eye colour

0 5 10 15 Brown Blue Green Hazel Grey/other Eye colour Number of students

Gaps between the bars: each bar is a separate group.

Groups go along the bottom. Number of students up the side.

Example data, not our class.

A range → histogram

Height

0 5 10 15 <140 140–149 150–159 160–169 170+ Height (cm) Number of students

No gaps: the ranges join on to each other.

Most people are near the middle; few are very short or very tall.

Example data, not our class.

Practise reading data

Use the height histogram

  1. Which height range is the most common? 150–159 cm, 11 students.
  2. Which ranges are the least common? Under 140 cm and 170 cm and over, 2 students each.
  3. How many students are 160 cm or taller? 7 + 2 = 9.
  4. How many students are in the class? 2 + 6 + 11 + 7 + 2 = 28.

In a test, always quote the numbers from the graph, with units.

Lab manual p12 to p13

Questions

  1. Which feature showed the most variation in our class?
  2. Eye colour falls into clear groups, but height does not. Why do you think this is?
  3. Why is variation within a species important for its survival if the environment changes?

Then draw your bar graph of eye colour and your histogram of height on p13.

Why it matters

Rabbits in Australia

In 1950 scientists released a virus to control Australia's rabbit plague. At first it killed more than 99% of the rabbits it infected.

But rabbits varied. A few had genes that helped them survive the virus.

Those survivors bred, and passed the genes on. Within years, many more rabbits survived it.

If every rabbit had been identical, none would have survived. Variation lets a species survive when its environment changes.
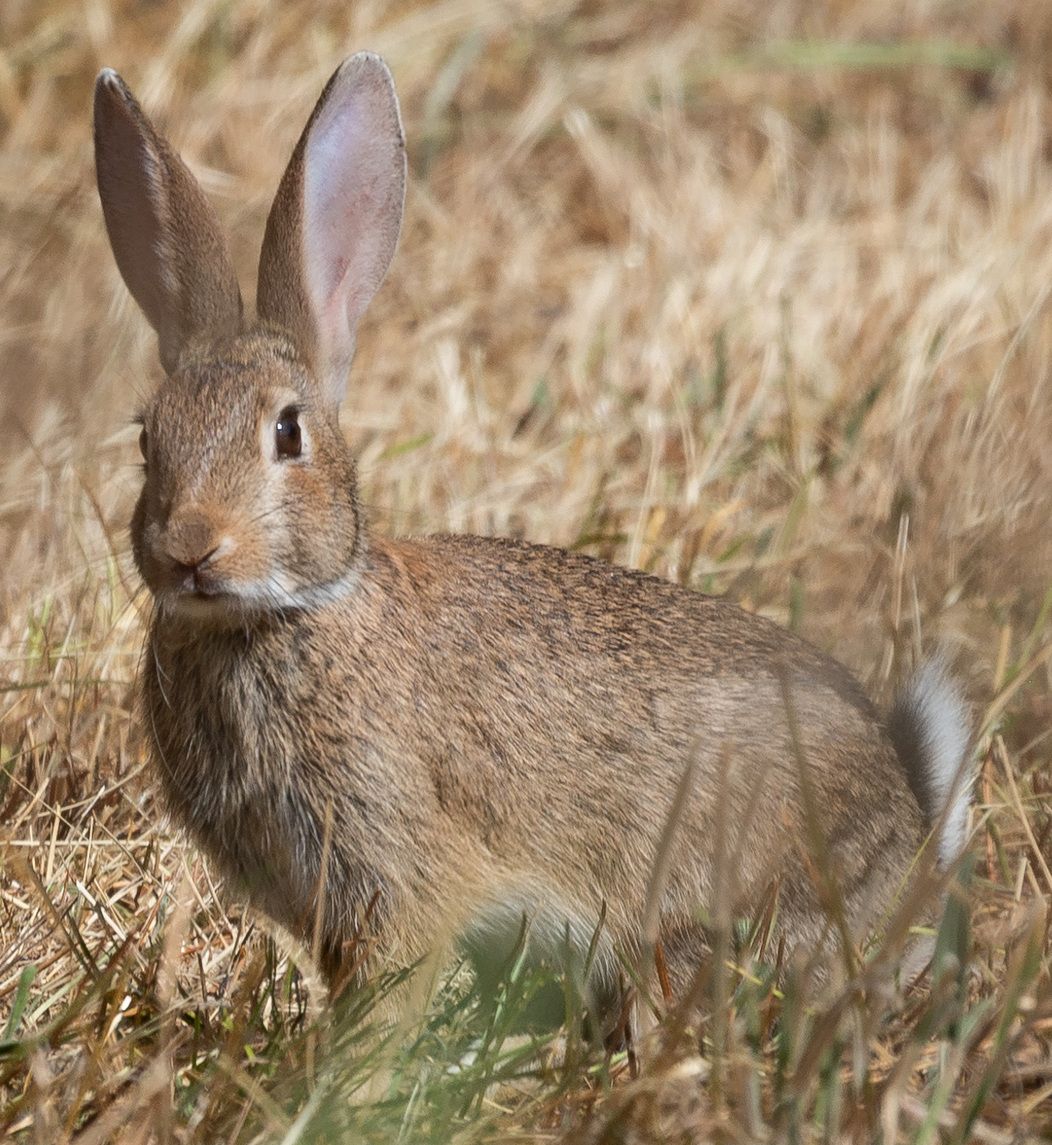
A wild European rabbit in dry grass
European rabbit. euqirneto, CC BY 4.0
A row of grove snails with different shell patterns

Exit question · Lab manual p13 Q3

Why is variation within a species important for its survival if the environment changes?

Angus Davison. CC BY-SA 4.0

Away today?

Missed this lesson? Catch up here